
Stuck in a long queue: the trunk road network around the capital region
Traffic on trunk roads out of the capital region has grown far beyond the pace at which those roads have been developed. On long 1+1 stretches the slowest vehicle sets the pace, and the delays cost society billions of krónur every year. Benefits could be maximised through 2+2 roads and a 110 km/h speed limit on certain routes, and projects should be prioritised accordingly.
Summary
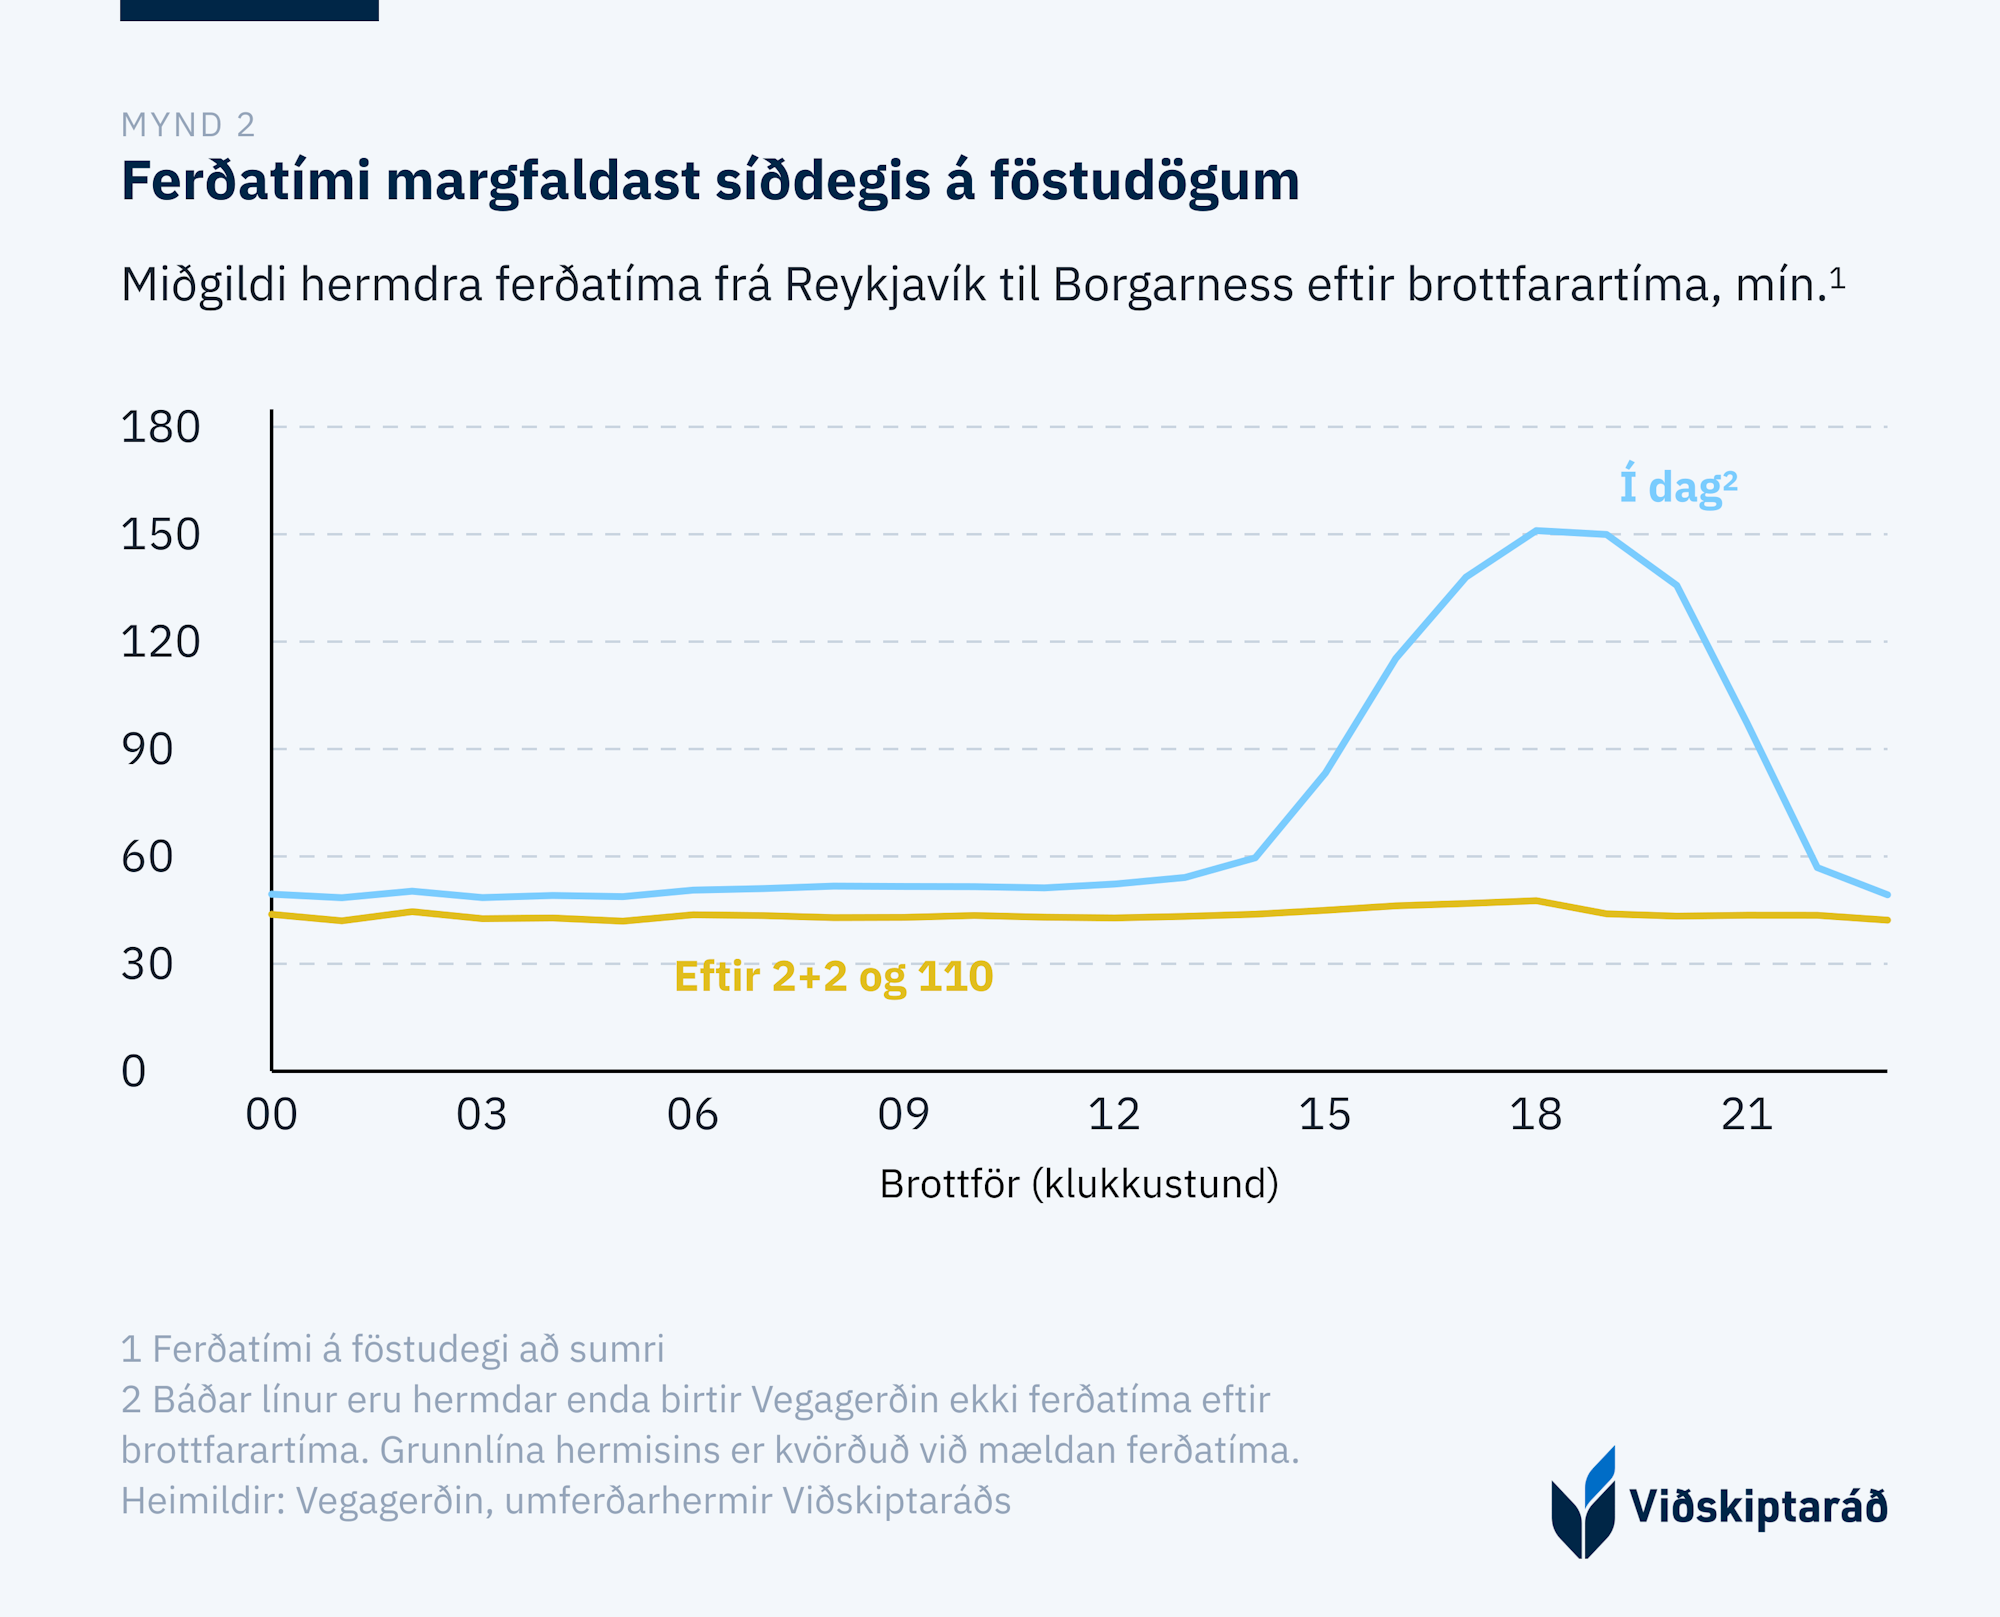
- The median travel time between Reykjavík and Borgarnes on a Friday afternoon would fall from 98 minutes to 45 with a 2+2 road and a 110 km/h speed limit.
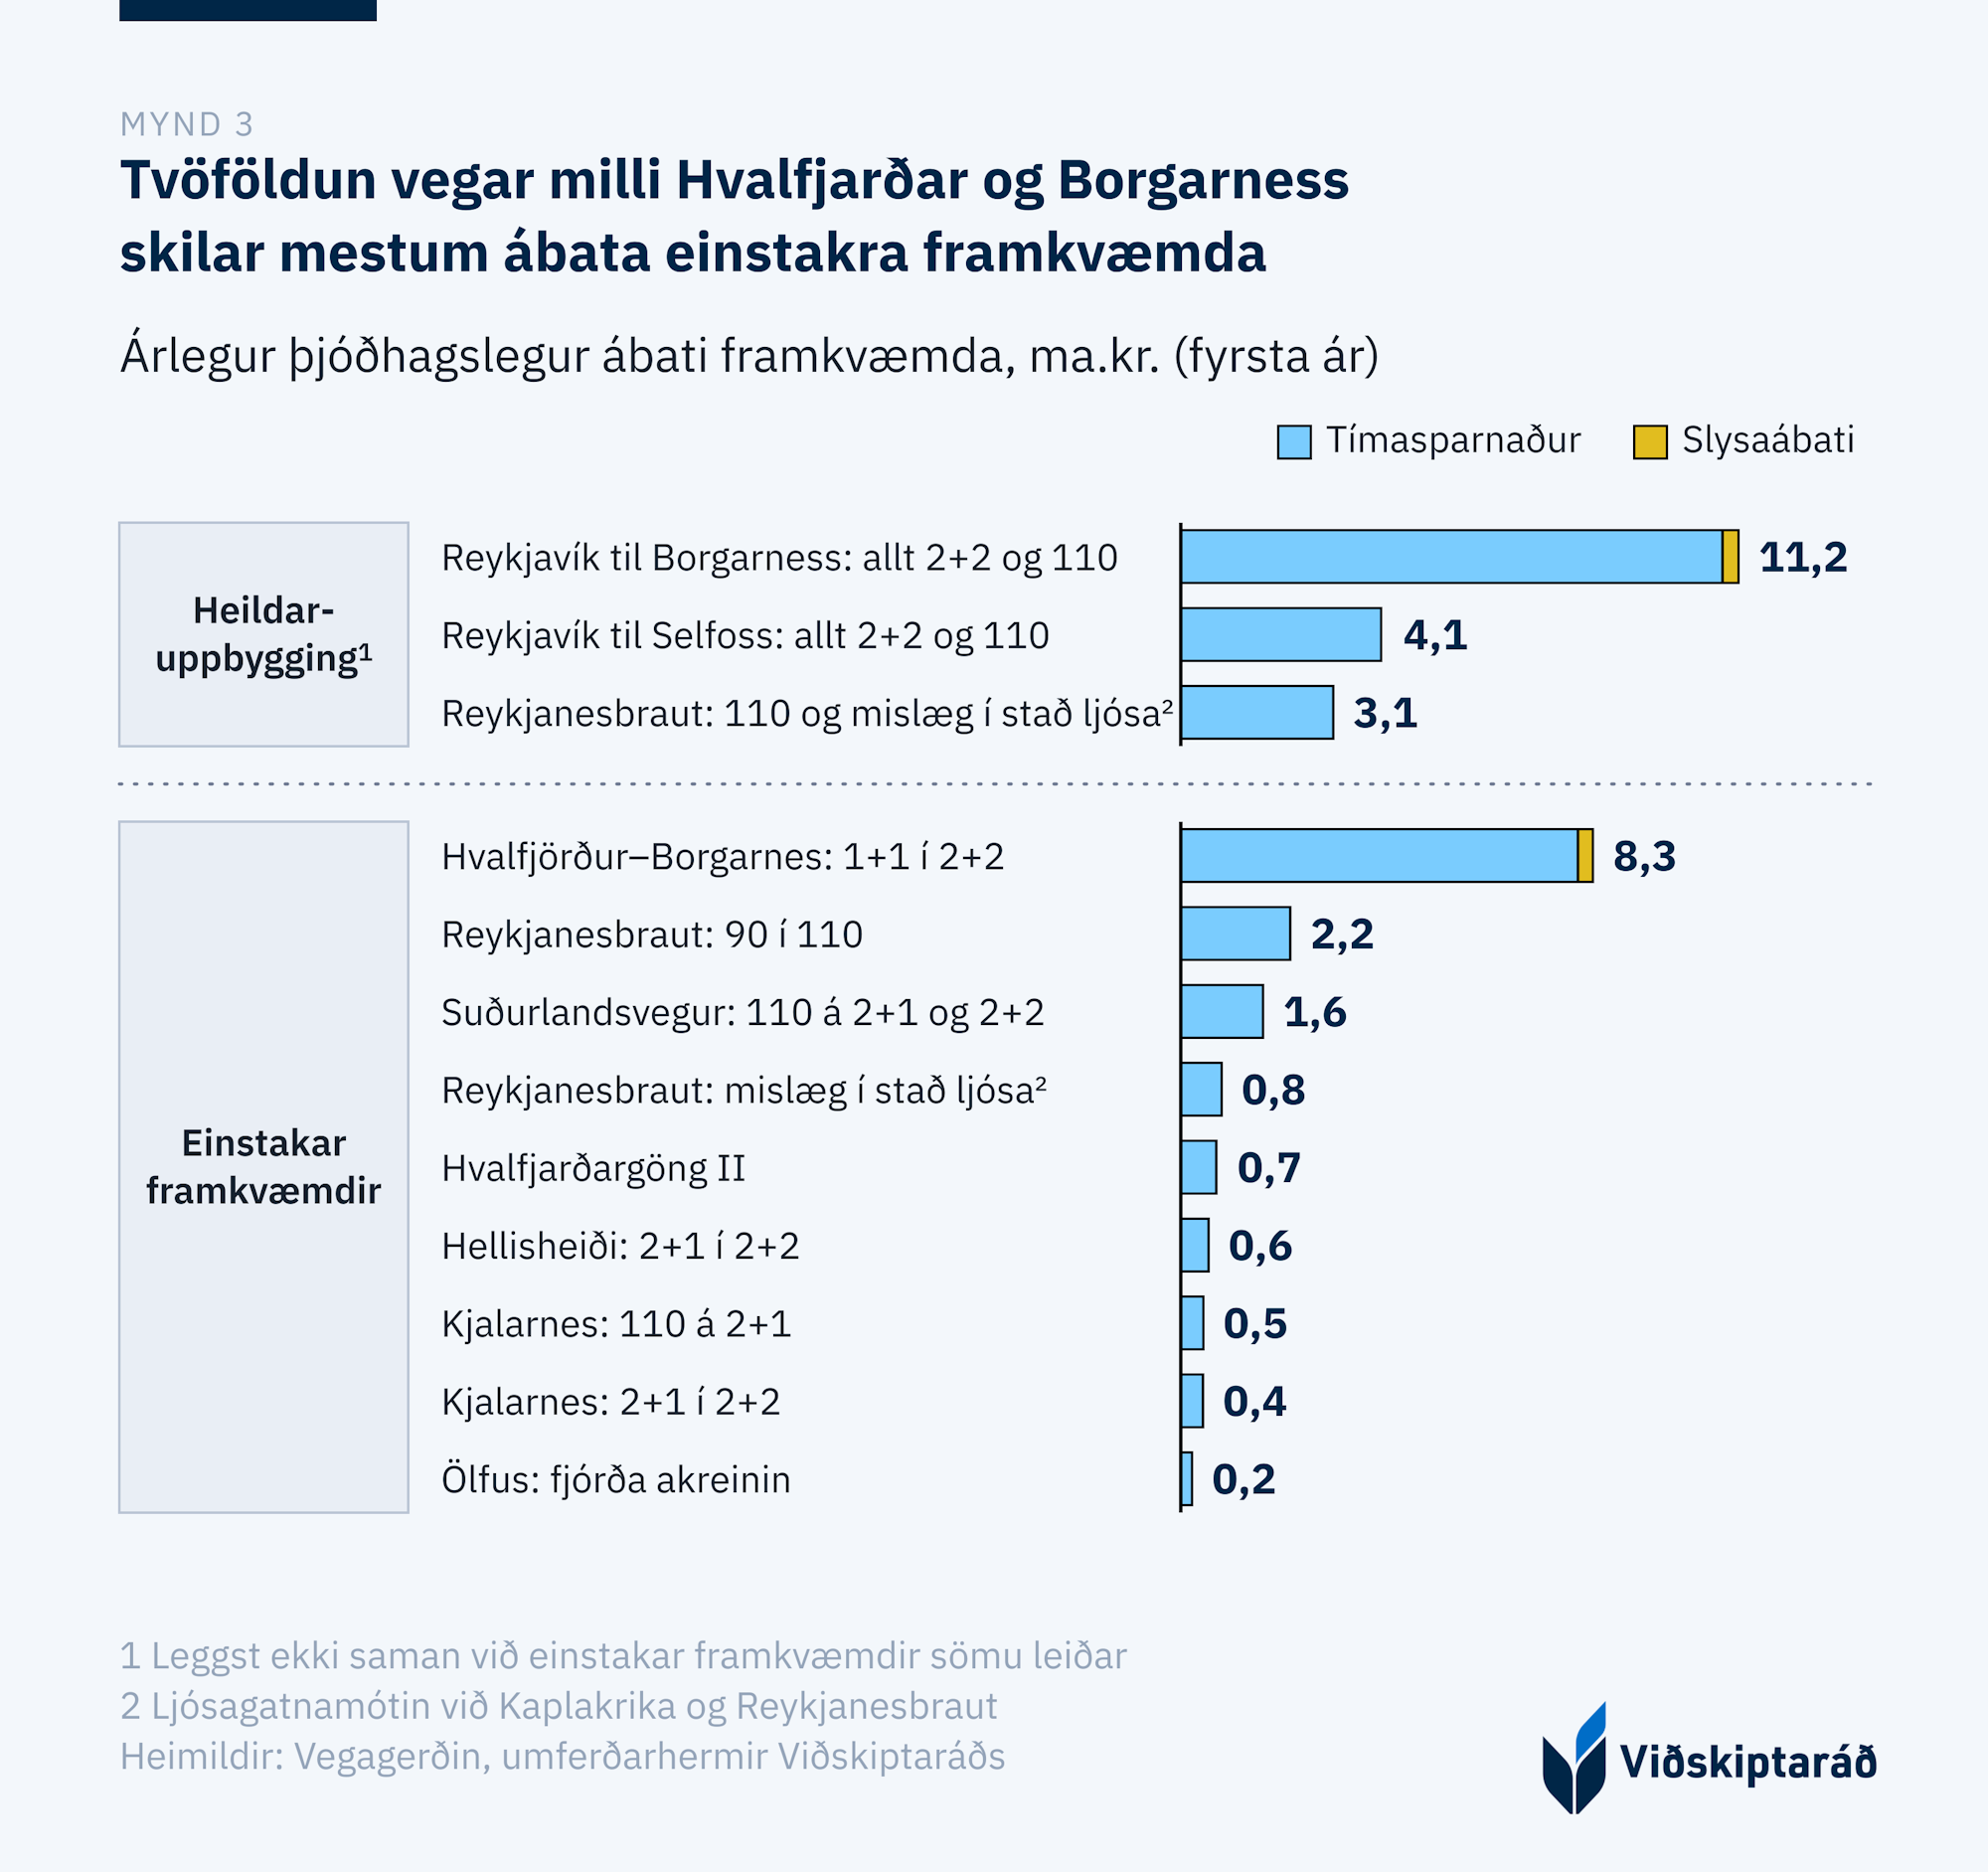
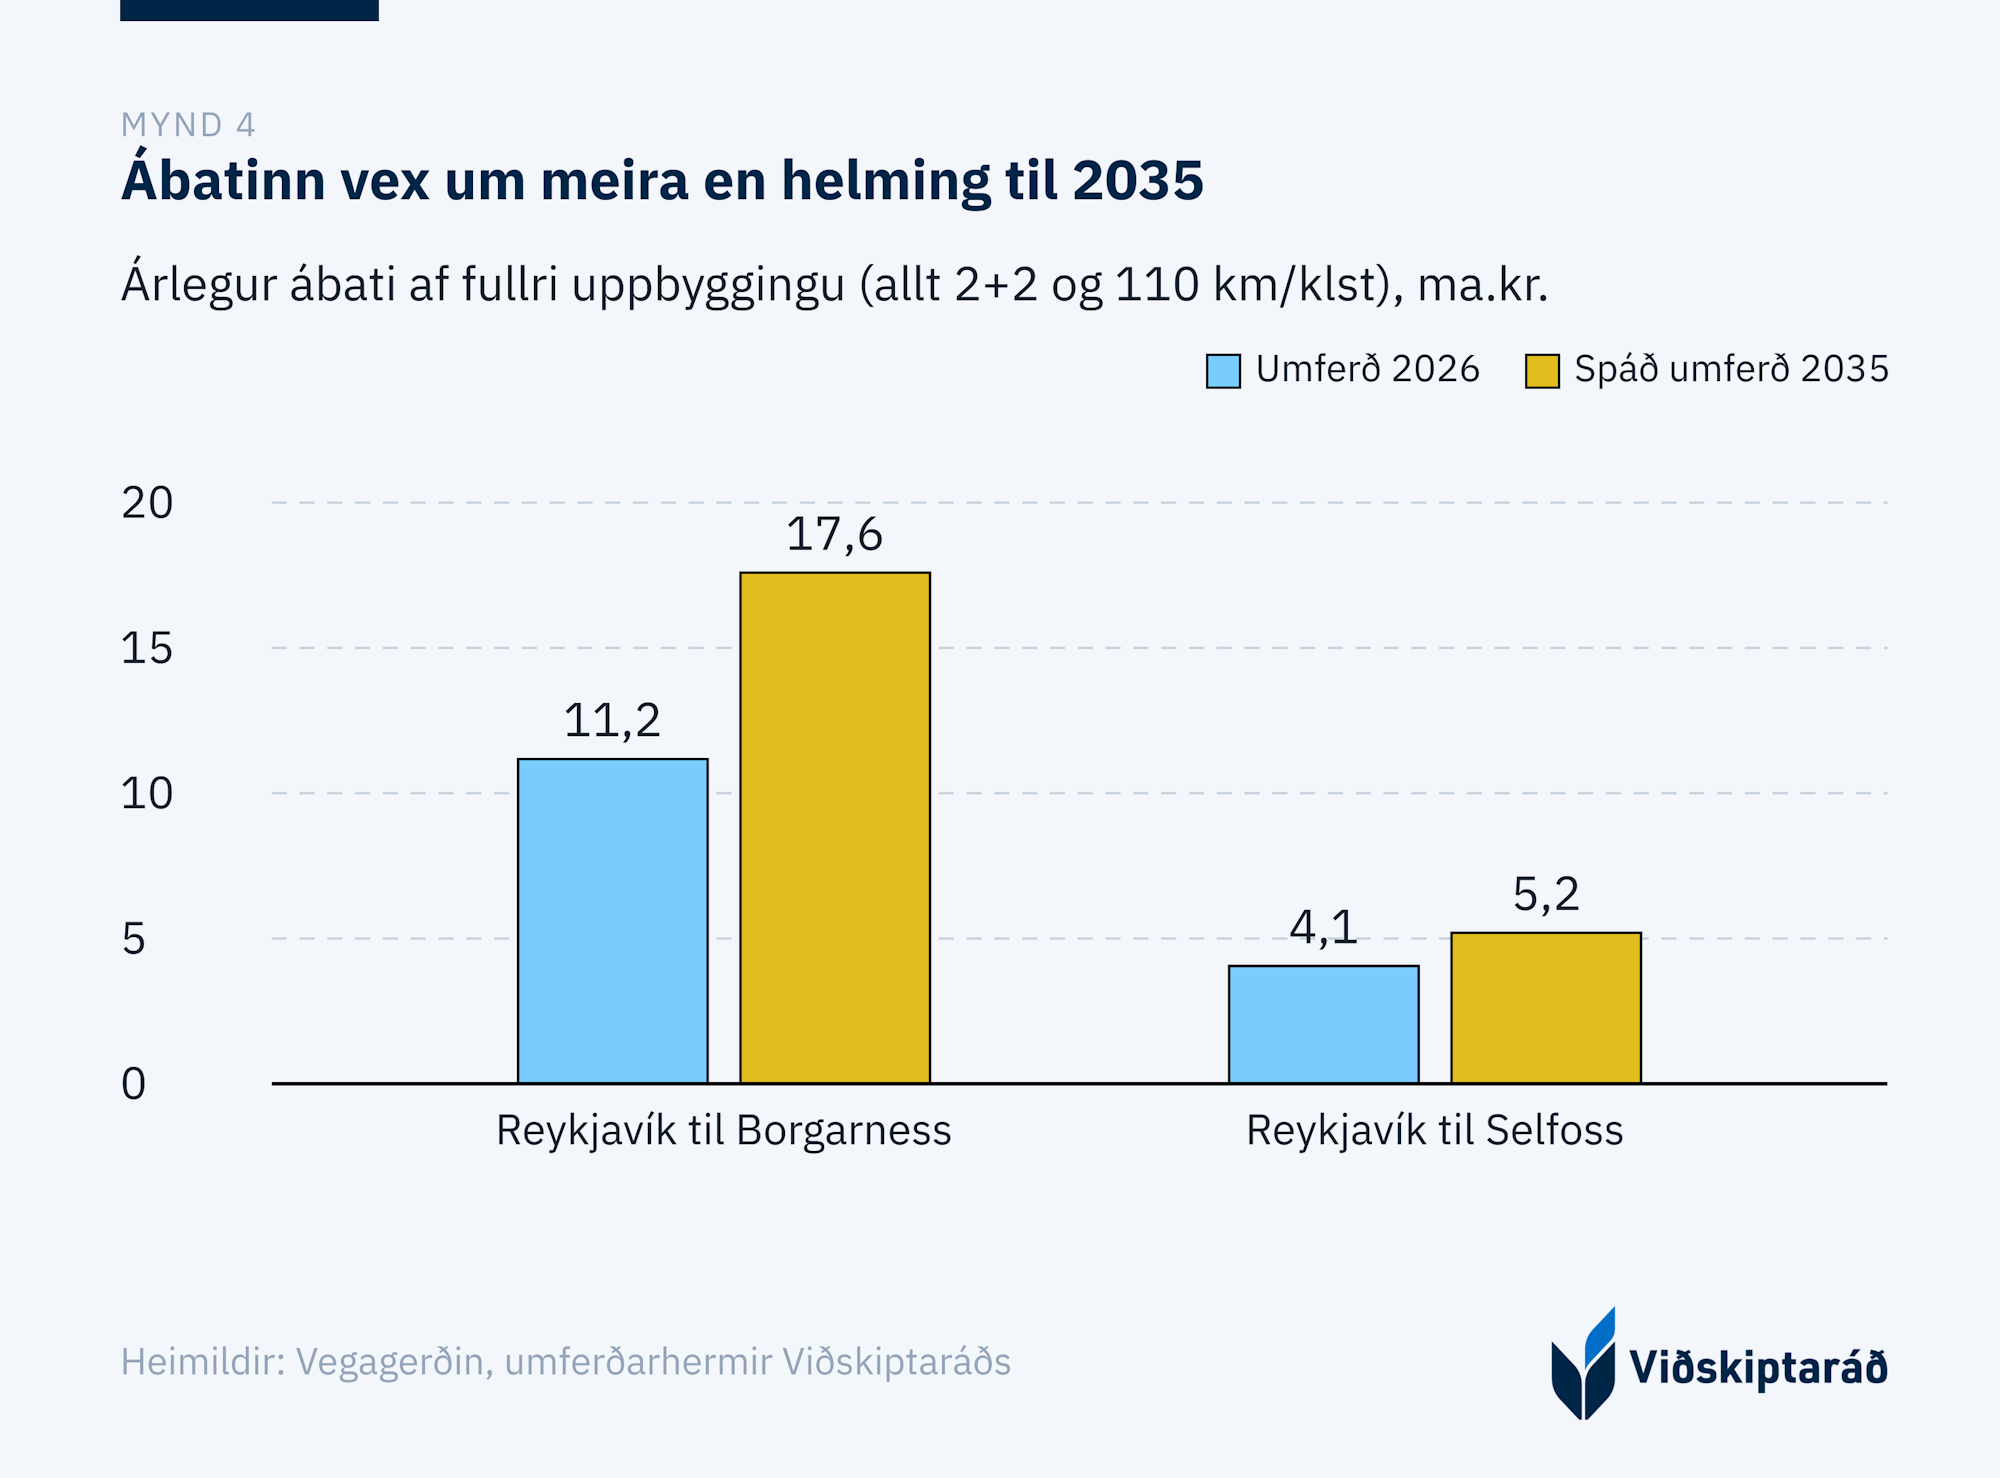
- Full development of the route from Reykjavík to Borgarnes would save around 1.3 million hours in traffic each year, equivalent to a benefit of some ISK 11.2 billion. The benefit grows as traffic increases, and construction should therefore be accelerated and the development conceived as a whole.
- Dualling the Hvalfjörður–Borgarnes stretch is the single most beneficial project: it would deliver around ISK 8.3 billion a year, more than the entire route from Reykjavík to Selfoss combined.
- Raising the speed limit on Reykjanesbraut to 110 km/h would deliver around ISK 2.2 billion a year. The change requires no construction and the power to make it already exists in the traffic legislation.
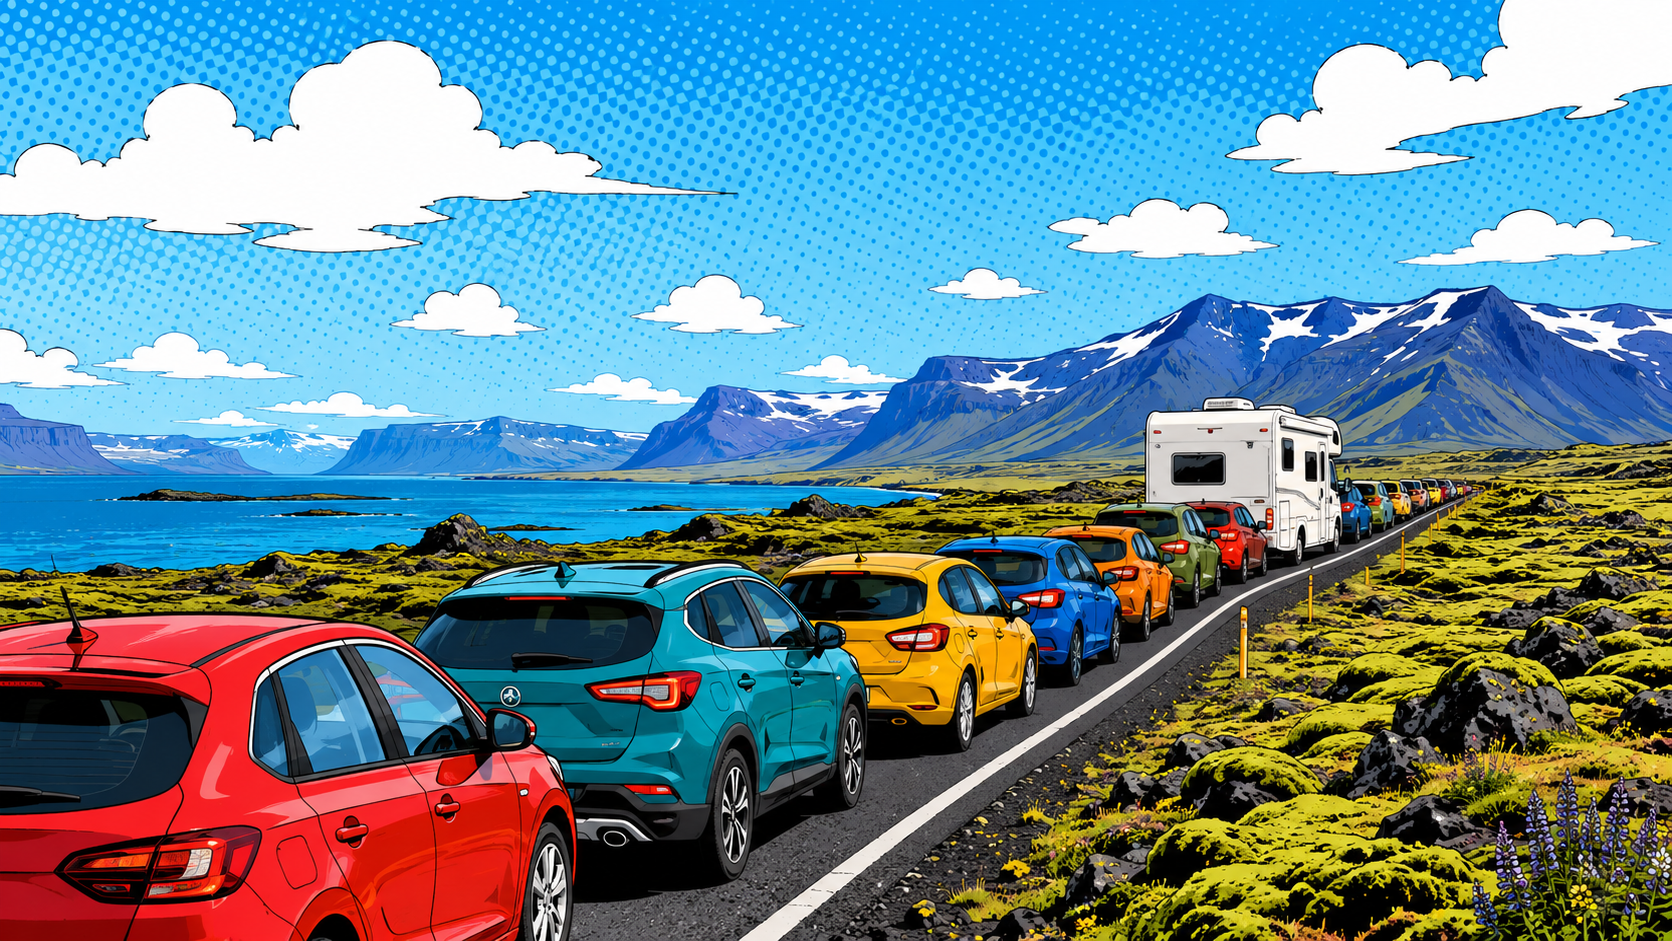
On a Friday afternoon in summer, on a two-lane highway out of the capital region, the same situation arises again and again. An entire convoy of cars sits at seventy kilometres an hour behind a single slow vehicle, with a constant stream of oncoming traffic making overtaking impossible. The delay on such a road is determined by one slow vehicle and by the gaps between vehicles that arise in the oncoming traffic. The average flow over the day says little about it.
In light of this, questions arise about the cost of the current configuration of the road network and what the benefit of specific improvements might be. To answer these questions, the Iceland Chamber of Commerce built a traffic simulator which is now available to everyone at vi.is/umferdarhermir. There you can test every scenario discussed here, watch the traffic move across the map, and change the roads with a few clicks.[1]
A model that simulates every vehicle
Most traffic models work with the average number of vehicles per hour, which yields a given delay. Such models fail to capture what happens on a 1+1 road, where the problem is about one slow vehicle and the gaps between vehicles in the oncoming traffic. This simulator goes further and simulates every single vehicle as an individual.
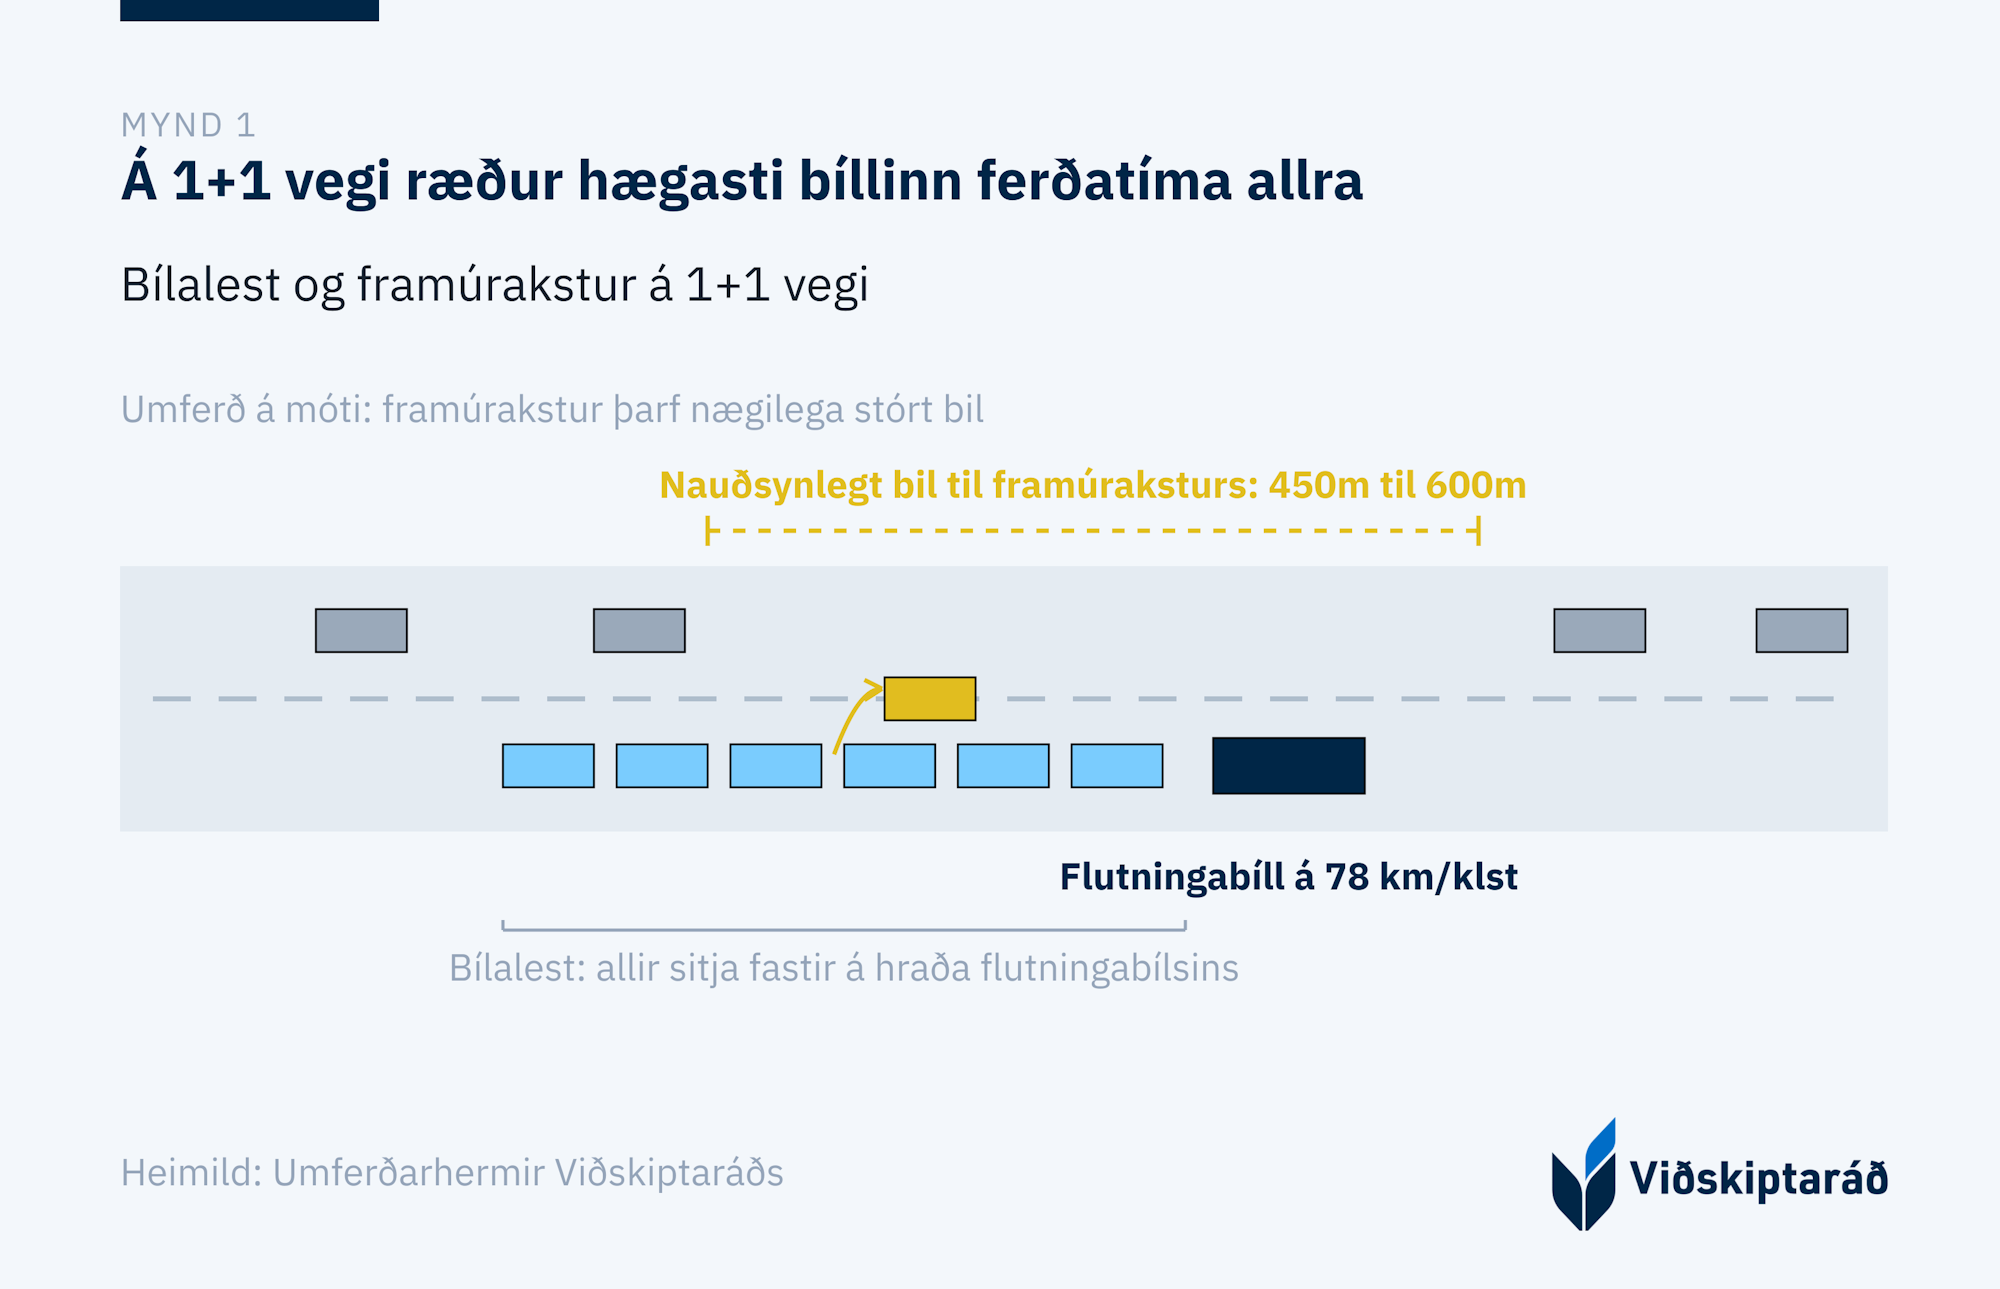
Each vehicle is assigned a desired speed — the speed its driver would choose on an empty road — drawn from a speed distribution measured on Icelandic highways[2] (around 92 ± 8 km/h on a 90 km/h road, lorries around 83 ± 5). The vehicles follow one another according to an established physical model[3],[4], in which a vehicle's speed depends on the speed of the vehicles in front of and behind it. On a 1+1 road, a vehicle can only overtake when a sufficiently large gap arises in the oncoming traffic — around 450–600 metres given a typical speed differential. As traffic gets heavier these gaps disappear, the convoys lengthen, and everyone ends up travelling at the speed of the slowest vehicle. On a 2+2 road overtaking is always possible and the problem disappears.[5] Roundabouts, traffic lights, and single-lane tunnels are simulated as bottlenecks with limited capacity.
The traffic volumes come from the Icelandic Road and Coastal Administration's actual figures: annual average daily traffic for 2025 for each road section[6], along with summer and winter traffic and the split by direction of travel. The roads themselves are based on their actual alignment from map data, including roundabouts, grade-separated junctions, and gradients. The model runs a full 24 hours, vehicle by vehicle — around 9,000 to 21,000 journeys a day on each route — and measures how long each one takes. On an ordinary weekday this equates to around 54 minutes from Reykjavík to Borgarnes, closely matching measured travel times, which is the test the baseline has to pass. The model, the data, and the assumptions are public.
What does the model say?
If the route from Reykjavík to Borgarnes were developed as a 2+2 road with a 110 km/h speed limit, the Friday afternoon would change from gridlock into a predictable journey. The median travel time at the busiest period of the week would fall from 98 minutes to 45 minutes. Most importantly, however, travel time would become far more predictable, and the need to plan one's departure to avoid the “wrong time” of day would diminish correspondingly.
The time saving is valued in monetary terms using the same method the Road Administration itself uses in cost-benefit assessments[7] — around ISK 5,510 per vehicle hour for cars and around ISK 11,980 for lorries, with a higher value placed on delays in heavy traffic. The accident benefit is based on official accident cost figures[8] and on the fact that separating directions of travel virtually eliminates head-on collisions[9]. This was demonstrated on Reykjanesbraut, where fatal accidents fell from four or five a year to zero after the road was dualled. It should be noted that no construction cost is assessed here; the figures show only the benefit, which could then be set against the cost estimates for each project.
Full development of the route from Reykjavík to Borgarnes (2+2 roads, a 110 km/h speed limit, a second Hvalfjörður tunnel, and grade-separated junctions) would save around 1.3 million hours in the car each year and prevent 33 accidents. That equates to around ISK 11.2 billion a year. The present value of the benefit over 30 years, assuming 2.3% annual traffic growth and a 3.5% discount rate, is around ISK 275 billion.
The scenarios were run in two ways: each project individually, and whole routes as a single package. That comparison brings out two main findings:
Dualling the Hvalfjörður–Borgarnes stretch is the single most beneficial project. This 39 km stretch of 1+1 road would deliver around ISK 8.3 billion a year on its own — more than the entire route from Reykjavík to Selfoss combined — and is also the most cost-effective of all the stretches per kilometre developed.
A higher speed limit is an almost cost-free benefit. Raising the speed limit from 90 km/h to 110 km/h on the fully built 2+2 Reykjanesbraut delivers around ISK 2.2 billion in annual time savings without a spade being lifted. This is one of two measures on the list that requires only signage and a decision by the authorities.
The network is a chain that must be considered as a whole
A second Hvalfjörður tunnel on its own would deliver only around ISK 0.7 billion, and dualling around Kjalarnes only around ISK 0.4 billion. While bottlenecks remain along the route, the queue simply moves elsewhere. The complete package delivers more than the sum of its individual stretches, and the development therefore needs to be conceived as a whole. Following the new road through Ölfus and the 2+1 stretches over Hellisheiði, the benefit of the route from Reykjavík to Selfoss is moderate, since the route is already separated and the major safety issue thereby resolved. Full 2+2 development with a 110 km/h speed limit would nonetheless deliver around ISK 4.1 billion a year, since weekend traffic heading east over the mountain has already exceeded the capacity of a 2+1 road.
Since the benefit grows alongside increasing traffic, the annual benefit of the Reykjavík–Borgarnes route can be expected to rise from ISK 11.2 billion to around ISK 17.6 billion, based on the traffic growth forecast to 2035. Every year that development is postponed therefore entails a forgone benefit that keeps growing.
A 110 km/h speed limit: the legal power already exists
When a 110 km/h speed limit is proposed, a common refrain is that no Icelandic road meets the statutory conditions for such a limit. On closer examination that claim does not hold up well.
The traffic legislation already permits speeds of up to 110 km/h where directions of travel are separated (Article 37 of Act No. 77/2019)[10]. That power has never been used. The Road Administration's road design rules[11] provide for a basic safety zone width of 10–12 metres at 110 km/h and state that obstacles within the zone should be protected with a barrier or crash cushion. A barrier thus takes the place of the obstacle-free zone. All the Nordic design standards examined contain an equivalent provision.
The experience of neighbouring countries confirms this. In Sweden, 110 km/h is permitted on 2+1 roads with wire rope barriers and a total width of 13–14 metres[12] — roads narrower than the new Icelandic 2+1 stretches. In Norway, 110 km/h has been permitted on motorways since 2014[13], with the clear rule that where a safety zone cannot be achieved a barrier must be installed. In Denmark the speed limit is 130 km/h. Iceland lags behind its neighbours with a 90 km/h limit on fully built 2+2 roads. That situation is a political decision rather than an engineering necessity. According to the model it costs just over ISK 2 billion a year on Reykjanesbraut alone.
An opportunity in the new infrastructure company
In June 2026 Parliament passed legislation on an infrastructure company — an independent state-owned company intended to finance and accelerate major transport projects through state equity contributions, borrowing, and user charges, independently of the annual appropriations of the transport plan.[14] The company's first projects will be the Ölfusá bridge, Sundabraut, and other tunnels under the transport plan. The same arguments apply to the country's most profitable road improvements. A project that delivers society more than ISK 8 billion a year can support financing of this kind, and the precedent is close at hand: the Hvalfjörður tunnel was financed through tolls and was paid off ahead of schedule.
The Iceland Chamber of Commerce's proposals
The Iceland Chamber of Commerce considers that the prioritisation of transport investment should be determined by measured benefit, and that the figures above give a clear indication of where it is greatest. The Chamber proposes the following:
1. Raise the speed limit on Reykjanesbraut to 110 km/h without delay. The necessary improvements to barriers should be made and lighting columns moved out of the safety zone where applicable. This is a maintenance task rather than an expensive infrastructure project and can deliver around ISK 2.2 billion a year from day one.
2. Raise the speed limit to 110 km/h on stretches that are already 2+1 or 2+2. On Kjalarnes and Suðurlandsvegur, almost 50 km of existing road can already carry a higher speed, with signage and upgraded road equipment as on Reykjanesbraut. This would deliver more than ISK 2 billion a year while full development is awaited — around ISK 1.6 billion on Suðurlandsvegur and around half a billion on Kjalarnes.
3. Dual the Hvalfjörður–Borgarnes stretch. This is where the single largest benefit lies, around ISK 8.3 billion a year — the greatest benefit per kilometre and the stretch where queues are longest today. The design should be based on 110 km/h from the outset.
4. Complete the Reykjavík–Borgarnes route in full with a second Hvalfjörður tunnel, 2+2 around Kjalarnes, and grade-separated junctions. The synergy is obvious and the whole delivers far more than the sum of its individual parts.
5. Develop Suðurlandsvegur to 2+2 with a 110 km/h speed limit as a whole rather than in small pieces. Each piece on its own merely moves the bottleneck.
Open assumptions
All the assumptions behind this analysis are available: the model, the data, and the calculations are open to everyone, and anyone can reproduce the results at vi.is/umferdarhermir. No model is a perfect replica of reality, but this one captures what average-based models miss: how a single slow vehicle, a gradient, or a roundabout can cause substantial delays in heavy traffic.
The next step is to set cost estimates alongside the benefit. The proportions are already clear, however: when the 30-year present value of the benefit of the northern route alone is around ISK 275 billion, it would take a great deal for construction costs to change the prioritisation. The Iceland Chamber of Commerce encourages readers to test the scenarios themselves — for example the Friday afternoon on the northern route — and to make the debate about the road network open, with figures anyone can examine, challenge, and recalculate.
References
[1] Iceland Chamber of Commerce traffic simulator (open source, data, and assumptions): github.com/vidskiptarad/umferdarhermir.
[2] Helga Þórhallsdóttir (2016). A model of 85th-percentile speed on two-lane roads (MSc thesis, University of Iceland / Icelandic Road and Coastal Administration), measured free-flow speed and distribution on Icelandic highways: vegagerdin.is/.../likan_85prosent_hrada.
[3] Treiber, M., Hennecke, A. & Helbing, D. (2000). “Congested traffic states in empirical observations and microscopic simulations”, Physical Review E 62, 1805 (Intelligent Driver Model): doi.org/10.1103/PhysRevE.62.1805.
[4] Treiber, M. & Kesting, A. (2013). Traffic Flow Dynamics: Data, Models and Simulation. Springer: doi.org/10.1007/978-3-642-32460-4.
[5] Kesting, A., Treiber, M. & Helbing, D. (2007). “General lane-changing model MOBIL for car-following models”, Transportation Research Record 1999, 86–94: akesting.de/download/MOBIL_TRR_2007.pdf.
[6] Icelandic Road and Coastal Administration, Traffic averages on highways (annual average daily traffic, summer and winter traffic 2025): vegagerdin.is/.../umferdarmedaltol-a-thjodvegum. Real-time traffic measurements: umferd.vegagerdin.is.
[7] Mannvit & COWI (2021). Sundabraut: socio-economic analysis (value of time and cost-benefit assumptions): stjornarradid.is/.../Sundabraut-fylgiskjal1.
[8] Haraldur Sigþórsson & Vilhjálmur Hilmarsson (2014). The cost of traffic accidents: vegagerdin.is/.../Kostnadur_umferdarslysa.
[9] Icelandic Road and Coastal Administration / Línuhönnun (2005). A comparison of 1+1, 2+1, and 2+2 roads (capacity and accident cost by cross-section): vegagerdin.is/.../2+1 Samanburdur.
[10] Traffic Act No. 77/2019, Article 37 (power to set a 110 km/h speed limit where directions of travel are separated): althingi.is/lagas/nuna/2019077.html.
[11] Icelandic Road and Coastal Administration, Road design rules, 02 Cross-section (safety zones and barriers): vegagerdin.is/.../VhRg02_Thversnid.
[12] Trafikverket, Vägars och gators utformning (VGU), 2022 (Sweden): trafikverket.diva-portal.org/.../FULLTEXT03.pdf.
[13] Statens vegvesen, Håndbok N101: Rekkverk og vegens sideområder (Norway): vegvesen.no/.../hb-n101.pdf
[14] Act on the infrastructure company, case No. 535 of the 157th legislative session, passed 18 June 2026: althingi.is/ferill/157/535..
This article was automatically translated from the Icelandic original.
Related Content
State investments need clearer cost-benefit analysis

A Supersized Pension System

R&D support system must be simple and predictable

Competition is about more than numbers

On a Yellow Card